
On 5th October 2017, Triton, the largest satellite of Neptune, occulted a 12.7 V-magnitude star, UCAC4 410-143659. This was predicted to be visible from a swathe of the Earth about 2,700 Km wide crossing the United Kingdom at about 23:48 UT on the 5th of October 2017. My observatory is about 600 Km north of the centre line of the predicted track and Neptune was at an altitude of 24° at azimuth 208°—well above my local horizon. At my location the middle of the occultation was predicted to be at 23:48:43 UT ± 8 sec and to last for 127.8 sec.
 I observed this occultation using my 10-inch LX200 (focal length 2450 mm) with my MX716 camera at prime focus and the red filter from an Astronomik LRGB set. The telescope was guided using an ST80 guidescope (focal length 400 mm). The camera was programmed to take 30-sec exposures repeatedly, which in practice meant every 33 seconds. These pictures were enhanced using the
star_mx7's non-linear stretch (which is similar to a high gamma function), a dark frame subtracted and the resulting pictures were used to generate the animated gif displayed here. The animation runs at 5 fps for 11 seconds and the occultation occurs after 5 seconds. At the end, the animation pauses for 3 seconds and then repeats. The bright object is Neptune and the fainter object to it's right is a combination of Triton and the star.
I observed this occultation using my 10-inch LX200 (focal length 2450 mm) with my MX716 camera at prime focus and the red filter from an Astronomik LRGB set. The telescope was guided using an ST80 guidescope (focal length 400 mm). The camera was programmed to take 30-sec exposures repeatedly, which in practice meant every 33 seconds. These pictures were enhanced using the
star_mx7's non-linear stretch (which is similar to a high gamma function), a dark frame subtracted and the resulting pictures were used to generate the animated gif displayed here. The animation runs at 5 fps for 11 seconds and the occultation occurs after 5 seconds. At the end, the animation pauses for 3 seconds and then repeats. The bright object is Neptune and the fainter object to it's right is a combination of Triton and the star.
The picture may appear out of focus, but that is not the case. The blurring of the objects (and, no doubt, the reason I could not resolve the star and Triton) is a combination of effects. Neptune was low in the sky, seeing conditions were far from perfect, and my guiding optics were too short for accurate guiding with such a long focal length imaging 'scope, plus the sensitivity of my system dictated a long exposure if I was to register the faint star and Triton.
Finally I used the dropper tool in an image-manipulation program to measure the brightness of the Triton-star combination and this is graphed below. The X-axis of the graph is in seconds after 23:35:31 UT. The predicted drop was 1.4 magnitudes but I have no way to verify this from my measurements. However I can read the length of the occultation as 132 seconds and the centre of the event as at 23:49:14 UT. Bearing in mind that each exposure is 30 seconds long, so that the measured intensity is an average over that period of time, I think these measurements are in excellent agreement with prediction.
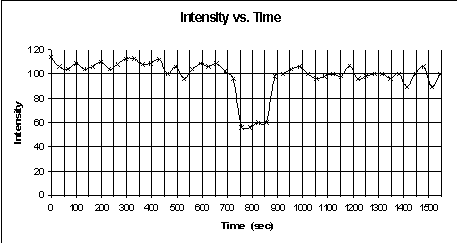 The times I have used for the various pictures were taken from the time stamp on the files, and as such can be taken as the ending time of the 30-second exposure. The camera software records a time for the exposure, and this is 16 seconds earlier then the time stamp (so may represent the mid-point of the exposure); the start time of the X-axis on this scale is 23:35:15. Looking at the graph, I think I can be more specific about the times of the start and finish of the occultation than the 30-second exposure would seem to warrant. Looking at the start of the occultation, the intensity measured at 724 seconds is close to the spread of readings I was getting prior to the occultation, so the occultation cannot have started much before the end of that exposure. Similarly the reading for the next picture at 757 seconds is very close to the next three readings so the occultation cannot have started much after the start of that exposure, so it is reasonable to time the start of the occultation at about 755 seconds. Similarly at the end of the occultation, the reading at 856 seconds is the same as the earlier three readings, and the reading at 889 seconds is close to the readings for subsequent pictures. So I estimate the end of the occultation to have been at about 887 seconds. This gives the length of the occultation as 132 sec. It is difficult to assign a possible error margin but it looks like about ±6 seconds to me.
I should mention that the clock in my computer was synchronised to GMT immediately before these observations by use of a radio-controlled clock that I have in my observatory and further verified with my quartz-controlled wristwatch set earlier that evening by the Greenwich time signal sent out on FM radio by the BBC.